
AI Agency Automation Services & SEO
Toronto, Ontario, Canada
Let's climb to the top of your market, one custom automation at a time.
Phone: +1 (647) 691-0082
Email: [email protected]
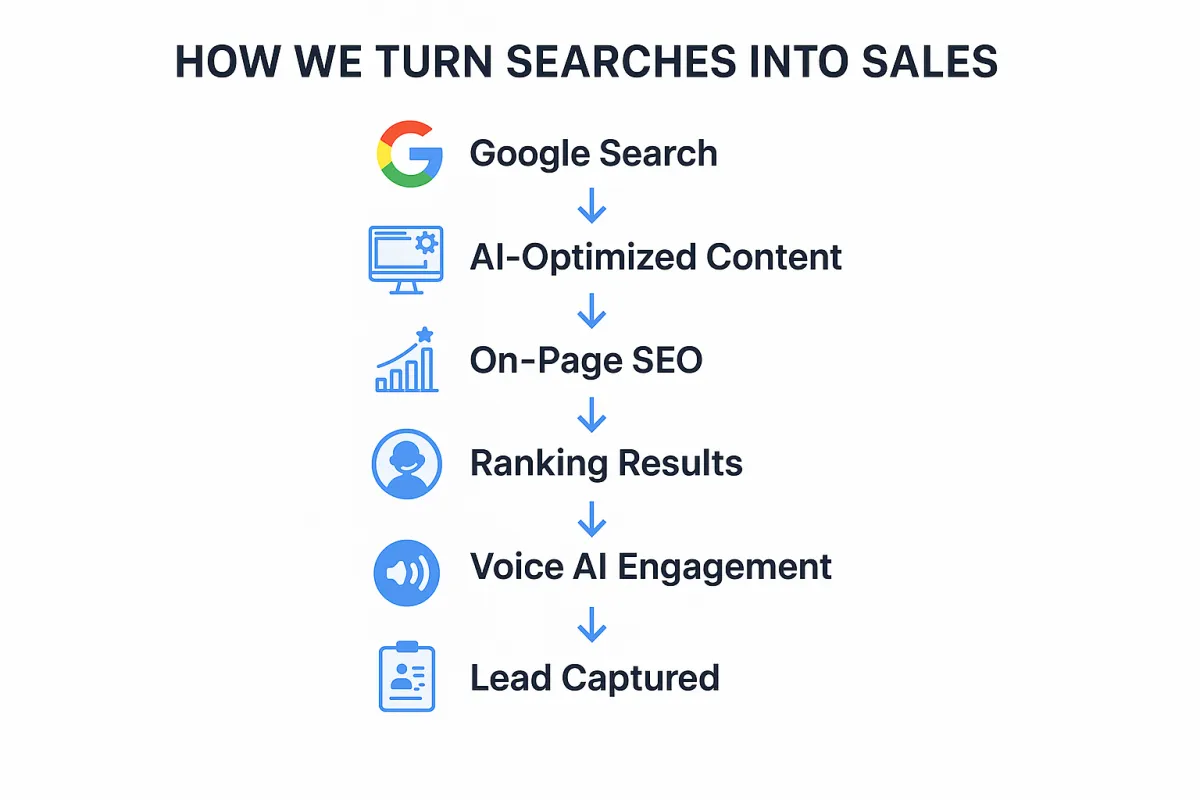
Automated Voice AI Call Centre Using AI Agents with Personality
Agents that Work 24/7 - No Hold Times
Dedicated Phone Numbers
Speak to Multiple Customers
Speak in Multiple Languages
Customized Personality and Accents
Trained On Any Service or Document
Book Appointments Onto Calendars
Update CRM After Data Extraction
Provide Post Call Reports
Never Take Breaks
Never Get Tired
Never Retire


Customer Service Operations, Technical Support, Sales, After Hours
AI News, AI Updates, AI Guides

106K Jobs Gone in 60 Days — Inside Canada’s Labour Shock, AI Adoption and the Real-Estate Collapse
In July and August 2025 Canada lost roughly 106,300 jobs — about 0.5% of the employed workforce in 60 days — a sharp, peacetime shock that demands national action. (Statistics Canada; Reuters)

This is not ordinary monthly churn. Two consecutive months showed large net declines, losses were broad across services and high-exposure industries, and youth & part-time employment fell particularly hard — all signs this is more than seasonal volatility.
Canada job losses July August 2025 — Quick snapshot (headline numbers & fact panel)
Headline figures (monthly):
July 2025: ≈ −40,800 jobs. (Statistics Canada, Labour Force Survey — reference week July 13–19)
August 2025: ≈ −65,500 jobs. (Statistics Canada — August LFS reporting summarized by major press)
Two-month total: ≈ −106,300 jobs (sum of July + August).

What that means for Canada’s workforce — step-by-step arithmetic:
Use a labour-force snapshot for context (round figures used in public reporting):
Labour force ≈ 22,550,000
Unemployed ≈ 1,600,000
Compute employed:
Employed = Labour force − Unemployed
Employed = 22,550,000 − 1,600,000 = 20,950,000
Compute percent of employed lost across two months:
Fraction = Jobs lost ÷ Employed = 106,300 ÷ 20,950,000 = 0.00507398568…
Percent = Fraction × 100 = 0.50739856…% → round → ≈ 0.51% of employed Canadians.
Jobs lost per 1,000 employed:
(106,300 ÷ 20,950,000) × 1,000 ≈ 5.07 jobs per 1,000 employed.
Plain language: losing ~106,300 jobs in 60 days equals losing about 0.51% of the employed population (roughly 5 jobs per 1,000 workers) — a blunt metric that highlights speed and scale in a short window.
Quick note on volatility & margins of error (methodology pointer):
The Labour Force Survey (LFS) is a sample survey; monthly estimates have sampling variability and standard errors. Single-month swings can be noisy.
Two consecutive large monthly declines reduce the probability the result is pure sampling noise, but analysts still treat month-to-month LFS moves cautiously and look for corroborating indicators (vacancies, payroll survey data, GDP).
For readers: the LFS guide and Government of Canada publications explain margins of error, seasonal adjustment, and recommended interpretation of short-run movements — use those methodological notes when publishing or quoting these monthly figures.
(Source framing: Statistics Canada Labour Force Survey monthly releases for July & August 2025; contemporary press synthesis including Reuters.)
Unemployment rates: Canada vs. U.S. vs. China (a short, clear comparison)
Headline unemployment rates (latest snapshot):
Canada (Aug 2025): ~7.1% — the jobless rate rose after the sharp employment declines in July and August.
United States (Aug 2025): ~4.3% — materially lower than Canada in the same month.
China (mid-2025, urban surveyed): ~5.0–5.2% — use with caution because this is the urban survey metric, not a directly comparable national unemployment rate.
What the headline numbers tell you — and what they don’t:
Headline unemployment rates are a fast way to compare labour-market health across countries. Canada’s roughly 7.1% in August 2025 sits clearly above the U.S. rate for the same month and above China’s official urban rate — a signal that Canada’s labour market was under material strain in late summer 2025.
But headline % is incomplete. Read these additional signals to understand the quality of the shock:
Labour-force participation: if fewer people are actively looking for work, the unemployment rate can understate distress. Check participation trends alongside the headline rate.
Youth and part-time employment: the July–August weakness disproportionately hit young workers and part-time roles; spikes in student/youth unemployment and lost part-time hours indicate distributional scarring that the aggregate rate masks.
Long-term unemployment / duration: rising shares of long-duration unemployment point to structural damage that needs different policy responses than short, cyclical job losses.
Cross-country survey differences: China’s urban survey covers a different population and uses different methods than Canadian and U.S. surveys, so international comparisons should be treated as directional rather than exact.
Bottom line: Canada’s headline ~7.1% jobless rate in August 2025 is a clear sign of labour-market stress relative to peers, but policymakers and analysts must look beyond the single number — participation, youth/part-time losses, and unemployment duration tell the fuller story.
Historical comparison: how this two-month shock stacks up
Bottom line: losing ≈106,300 jobs in July–August 2025 is a fast, meaningful peacetime deterioration — big enough to matter urgently — but far smaller in raw scale than major crisis-era shocks. To make the shape of the risk obvious, we compare pace (how quickly jobs disappeared) and scale (total jobs lost) against three benchmark shocks.
Quick numbered comparisons (rounded)
July–Aug 2025 (Canada): ≈ −106,300 jobs — the event we’re analyzing.
Great Recession (Canada, Oct 2008 → mid-2009): ≈ −400,000 jobs (total over many months).
COVID collapse (Canada, Mar–Apr 2020): millions lost — April 2020 alone saw nearly −2,000,000 jobs; cumulative March–April losses exceed ≈ −3,000,000.
U.S. April 2020 (single month): −20,500,000 nonfarm payrolls — the largest single-month drop on record.
What those comparisons tell us

Scale: COVID-era losses and the U.S. pandemic numbers dwarf the two-month 2025 decline. In rough multiples: the pandemic collapse was ~28× larger than July–Aug 2025 (using March–April Canada totals), and the U.S. April 2020 payroll collapse was ~193× larger than the recent Canadian two-month loss.
Pace: July–Aug 2025 compressed ~106k lost jobs into 60 days (≈ 53k per month) — that pace is alarming in a non-crisis year because typical peacetime monthly moves are far smaller and more mixed. By contrast, the Great Recession’s ~400k losses were spread across many months, so the immediate monthly hit was usually smaller even though the cumulative cost was larger.
Nature (peacetime vs. crisis): COVID and the U.S. April 2020 numbers reflect extraordinary shutdowns and policy-driven stoppages — they’re not normal business-cycle events. July–Aug 2025, by contrast, is a peacetime labour-market weakening tied to demand, trade, and structural forces (including automation pressure), which makes policy responses and retraining choices different from emergency income support.
Sector job losses Canada 2025: Sector & demographic breakdown (where losses landed)
Short summary: July–August 2025 losses were broad but uneven — concentrated in vulnerable services, early-career roles, and regions tied to trade and construction. July’s weakness hit different pockets than August’s, which was deeper and more widespread; together they show both industry concentration and a large distributional hit to youth and part-time workers. (Sources: Statistics Canada July LFS; Statistics Canada August LFS reporting; Reuters coverage.)
Industry picture — what fell and where (high-level)
Professional, scientific & technical services: slipped notably in August as project work and contract hiring cooled — signalling pain in white-collar, project-based work where firms often pause hires first. (Statistics Canada; August reporting)
Transportation & warehousing: while July actually showed an uptick, August losses were sharp in transport-related roles as freight, logistics and warehousing employers pared hours and staff during the slowdown. This volatility underlines how quickly trade and demand shocks can flip employment in logistics. (Statistics Canada; Reuters)
Manufacturing: exposed to trade/tariff uncertainty and weaker external demand, manufacturing saw larger job pulls in August compared with July — a sign that trade policy is translating quickly into domestic hiring cuts. (Reuters; sector tables)
Information, culture & recreation; business support; construction: July’s headline declines were concentrated in information/culture/recreation (large monthly fall), construction (notable monthly drop), and business support services — all industries sensitive to consumer demand and short-term contracts. (Statistics Canada July industry tables)
Interpretation: July’s losses highlighted fragile seasonal and consumer-exposed industries; August broadened the hit into professional services, transport and manufacturing. The combined effect is both depth (many jobs lost quickly) and breadth (across skill levels and sectors).
Demographic detail — youth, students, part-time vs full-time
Youth & returning students: the summer was especially brutal. Employment for ages 15–24 fell by ~34,000 in July, and the unemployment rate for returning students (15–24 who plan to return to school) was ~17.5% in July — the highest July figure since 2009 (excluding 2020). Youth unemployment overall was elevated (~14–15% range in July/August), pointing to high scarring risk for early-career workers. (Statistics Canada)

Part-time vs full-time: the monthly pattern differed: July’s losses included large full-time declines, while August’s drop was reported as concentrated heavily in part-time positions (though full-time fell too). That mix matters because part-time and student jobs are often the entry-level ladder for young workers; losing them reduces immediate income and future experience-building opportunities. (Statistics Canada; Reuters)
Long-duration & confidence signals: StatCan noted a rising share of long-term unemployed and falling employment rates/participation in July — signs not just of churn, but of people taking longer to find work. Employee confidence measures were weakest in professional services, information/culture recreation and accommodation/food services — sectors we already see in the job-loss lists. (Statistics Canada)
Regional notes — provinces and local exposure
Ontario: large exposure via manufacturing supply chains and big urban service hubs (Toronto’s unemployment and jobless pressures were pronounced).
British Columbia & Alberta: both saw monthly employment declines in July; Alberta’s unemployment rose sharply in July. Resource and energy exposure plus regional construction slowdowns amplify risks.
Prairies / manufacturing corridors: provinces with heavier manufacturing footprints are more sensitive to U.S. tariff shocks and export demand swings — making them liable to deeper or more persistent losses if trade uncertainty continues. (Provincial LFS tables; provincial forecasts)
What this distribution implies (short analysis)
Entry-level scarring: high student and youth unemployment means fewer ladders into career-track jobs — the classic “lost summer” problem that depresses future earnings and mobility.
Dual hit to skills pipeline: where SMEs automate or freeze hiring, fewer on-the-job training slots exist — reducing the organic reskilling that used to happen through employment.
Regional inequality risk: provinces tied to manufacturing, exports and regional construction could see longer recoveries without targeted retraining and local job-creation programs.
Real estate job losses Canada 2025: The role of housing & construction

Short summary: cooling housing markets don’t just hit homeowners — they transmit quickly into construction, trades, real-estate services and finance jobs. In 2025 weaker prices and slowing starts reduced demand for builders, tradespeople, brokers and related professional services — creating both immediate layoffs and a larger tail-risk if pre-sales and housing starts keep falling.
Housing market slowdown — what changed this year
2025 saw cooling home sales and downward price pressure in several major markets as higher borrowing costs and weakening demand fed through to lower transaction volumes and fewer new starts. Public housing-agency outlooks and contemporaneous market polls showed a clear moderation in sales activity and prices across key metros.
Lower transaction volume and fewer new-build starts mean less short-term hiring for developers, general contractors, trades (plumbers, electricians, framers), and the professional ecosystem (estimators, site supervisors, inspectors, mortgage brokers and real-estate agents).
(This section will be footnoted in the sources block with national housing outlooks and major press summary reports.)
Construction & pre-construction risk: the tail-risk scenario

Industry modelling highlighted by market analysts warned of large potential exposure in housing-related employment if pre-sales, permits and starts continue to decline. Some industry estimates put the at-risk range in the order of ~105,000–170,000 jobs tied to housing construction and pre-construction activity under downside scenarios.
Important: those figures are scenario estimates—not realized job losses—used to show scale of vulnerability if starts and pre-sales weaken further. They are useful for planning and policy but should be treated as risk forecasts rather than current counts.
Channel effects — how falling housing markets ripple through the job market
Direct construction impact: fewer new starts → fewer onsite crews and subcontract hours → immediate layoffs for trades and labourers.
Developer & professional services: cancelled or delayed projects reduce demand for estimators, project managers, architectural and engineering services.
Real-estate services & finance: lower sales volumes reduce commissions for agents and mortgage brokers; lower refinancing and purchase activity reduces bank/commercial mortgage staffing and related back-office roles.
Local services & supply chain: lower activity at construction sites reduces demand for local suppliers, equipment rentals, and even retail tied to renovation spending, producing cascading local job effects.
Feedback loop to consumer spending: construction-worker layoffs reduce local household incomes, which then depress retail, hospitality and services in affected municipalities.
Localities to watch (high exposure)
Toronto & the Greater Golden Horseshoe: largest volumes and largest stock of pre-construction projects — a sustained slowdown here has outsized national employment effects.
Vancouver & Lower Mainland: high-price market with sizable construction and pre-sale pipelines; price corrections and slower starts can quickly affect local trades and real-estate services.
Major suburban corridors & manufacturing-linked regions: where building starts feed regional employment in manufacturing of building components, logistics and trade labour.
(Provincial LFS tables and regional housing-start data will be used in the full draft to quantify the exact provincial job exposures and recent month-to-month changes.)
Short analysis — why housing weakness matters for the broader jobs picture
Housing and construction jobs are both large and local: they provide many point-of-entry and mid-skill roles (trade apprentices, carpenters, truck drivers) that support local economies. Losing those jobs reduces on-ramps for many workers and can lengthen regional recoveries.
When housing-based layoffs coincide with broader service and manufacturing losses (as in July–Aug 2025), the result is compounded local pain — fewer alternate hiring options and more pressure on social supports.
The policy implication: targeted construction-sector supports, time-limited incentives for starts tied to green/retrofit work, and retraining pathways for tradespeople into related infrastructure projects can blunt both immediate layoffs and long-term scarring.
Why this happened: proximate causes (demand, trade, hiring freezes & automation)
Short thesis: the July–August 2025 job losses were the result of several overlapping forces — a demand shock (soft GDP and slowing consumer spending), trade and tariff anxieties that hit export-exposed sectors, a rapid pullback in hiring and vacancies, seasonal student/job shifts, and a surge in firms choosing AI/automation when cost pressures rose. Together these factors turned what might have been a slow soft patch into a fast, broad employment decline. (Sources: Statistics Canada; Reuters; Global News; McKinsey.)
1) Demand / GDP softness
What happened: macro demand cooled in mid-2025 — weaker retail sales, slowing business investment and softer GDP growth expectations — which reduced employers’ willingness to hire or expand.
Why it matters: when demand falls, firms first slow hiring, cut hours, or trim project-based roles; sectors tied to consumer spending and contracts (hospitality, info/culture, some professional services) feel the hit immediately.
Source note: this pattern was flagged in contemporaneous reporting and StatCan commentary on the Labour Force Survey and GDP indicators. (Statistics Canada; Reuters)
2) Trade & tariff anxieties (manufacturing & transport channels)
What happened: uncertainty about trade policy and tariffs — plus weakening external demand — created a rapid pullback in export-sensitive manufacturing and in transportation/logistics volumes.
Why it matters: manufacturing and freight firms adjust staffing quickly when orders and shipments fall; the result: swift layoffs in factories and warehousing, and secondary effects on supply-chain jobs.
Source note: trade/tariff coverage and industry reporting highlighted the link between export uncertainty and the August job pullback. (Reuters; Statistics Canada)
3) Hiring freezes and falling vacancies (labour-market cooling)
What happened: firms instituted hiring freezes and cut open positions; job-vacancy series and employer surveys showed vacancies retreating to a multi-year low in 2025.
Why it matters: falling vacancies mean fewer opportunities for displaced workers to find new roles quickly, increasing short-term unemployment duration and reducing re-employment rates.
Source note: national media and labour-market reports documented a sharp fall in vacancies and a rapid cooling of hiring intentions. (Global News; Statistics Canada)
4) Seasonal student & youth shifts (entry-level disruption)
What happened: summer hiring for students and young workers underperformed expectations — returning-student unemployment spiked in July — removing crucial entry-level positions.
Why it matters: youth and part-time roles are the primary on-ramps to long-term employment; losing them damages career pipelines and increases scarring risk for early-career workers.
Source note: Statistics Canada flagged elevated student and youth unemployment in the July LFS, an unusual pattern outside of pandemic distortions. (Statistics Canada)
5) Firms opting for AI & automation when under cost pressure
What happened: facing weaker demand and higher costs, many SMEs and some larger firms accelerated adoption of AI tools and workflow automation as a cost-and-scale lever instead of rehiring.
Why it matters: automation can substitute for routine administrative, clerical and some professional tasks — when firms lock in those efficiencies during a downturn, re-hiring may be permanently reduced even after demand recovers, increasing structural mismatch.
Evidence & nuance: surveys in 2024–25 showed rapid SMB uptake of AI/GenAI tools; macro studies (McKinsey) show a large share of cognitive/routine tasks are technically automatable — but net employment effects depend on retraining, new role creation and entrepreneurship. Automation is therefore an amplifier of the downturn’s employment effects, not the sole cause. (Microsoft / SMB surveys; McKinsey; Statistics Canada business-conditions reporting.)
Quick synthesis — why the mix made this shock fast and broad
These causes interact: demand weakness made firms cut or freeze hiring; trade uncertainty concentrated pain in manufacturing and transport; fewer vacancies reduced re-employment options; lost student/part-time roles raised youth joblessness; and automation choices amplified permanent displacement risk. The result is a two-month loss that is both deep (in targeted sectors) and wide (across skill levels and regions).
How much is AI/automation responsible? (nuance & evidence)
Short answer: AI and automation are a material amplifier of the July–August job shock, but they’re not the sole cause. Demand weakness, trade uncertainty, seasonal student losses and hiring freezes set the stage — firms under cost pressure often accelerate automation instead of rehiring, which can turn temporary layoffs into longer-term structural displacement if workers aren’t reskilled or new jobs are created locally.
Evidence that adoption is widespread (SMB signal): recent SMB surveys show rapid uptake of AI tools among small and medium firms — a majority are already using GenAI or automation to handle tasks that used to require human time. This widespread adoption means automation is now a realistic option for many employers facing cost or scale pressure.

What the research says about which tasks are most exposed: major workforce studies show the highest technical automation risk is concentrated in routine cognitive and clerical tasks (data entry, basic reporting, repetitive document drafting, standard customer-service flows). More advanced uses (creative judgement, complex interpersonal work, skilled trades) are less directly automatable today — but generative-AI capability is expanding the range of cognitive tasks that can be partially automated quickly. Crucially, researchers emphasize that “technically automatable” ≠ “will be automated” — the outcome depends on economics, regulation, and the availability of substitutes (software, cloud compute, vendors).
How automation amplifies a shock: when employers face falling demand they often choose the lowest-cost permanent fix. Replacing a single administrative hire with an automated workflow or paid SaaS integration reduces recurring HR cost and scales more predictably — attractive choices for tight-margin small businesses. If many firms do this during a downturn, the result is fewer entry-level openings and a slower jobs rebound, increasing the risk of long-term unemployment or skill mismatch.
Peak Demand POV (practical local view): Peak Demand’s clients often choose automation and workflow redesign to control costs and scale operations without the overhead of new hires. That choice has two effects we see repeatedly: (1) it creates skilled, higher-value roles (AI integrators, prompt-and-quality reviewers, ops leads) in a small number of firms; and (2) it removes many routine entry-level positions that used to be the stepping stones for early-career workers. The net effect locally is that automation creates some new, concentrated jobs while reducing the number of broadly available on-ramps — increasing the urgency of accessible retraining and apprenticeship programs.
What matters for policy & business response: because automation amplifies but does not fully explain the losses, responses should mix short-term demand support (to prevent firms from locking in permanent cuts) and medium-term supply-side measures (rapid reskilling, SME incentives to hire trainees, apprenticeships that convert displaced workers into “human-plus-AI” roles). Monitoring which roles firms automate — and funding training that maps to those new roles — is the clearest path to avoiding structural job loss.
Unemployment detail: long-term vs short-term, participation, and inequality
Short thesis: the headline unemployment rate hides important differences in who is losing work and how long they stay out of work. Rising unemployment that’s concentrated in long-duration joblessness, falling participation, and losses among youth, part-time, low-wage, and non-urban workers requires a different policy mix than a short, cyclical spike.
What “long-term unemployment” means — and why it matters
Definition (practical): long-term unemployment refers to people out of work for an extended period (commonly 27 weeks+ in BLS/StatCan reporting). Duration matters because the longer someone is unemployed, the harder it is to find new, comparable work — skills erode, networks weaken, and employers use unemployment duration as a screening signal. (Sources: Statistics Canada; Bureau of Labor Statistics.)
Why a rise in long-term unemployment worsens outcomes: long-duration unemployment raises structural unemployment risk (not just cyclical). It increases welfare costs, reduces lifetime earnings for affected workers, and slows aggregate demand recovery because long-term unemployed have lower spending and require more support.
Key indicators to watch (beyond headline %): share of unemployed 27+ weeks; median/average unemployment duration; employment-to-population ratio; labour-force participation rate; vacancy-to-unemployment ratio. These show whether the market is healing (high vacancies + falling duration) or hardening into structural mismatch (rising duration + falling vacancies). (Sources: BLS, StatCan)
Participation — the hidden weakness behind the rate
Why participation matters: the unemployment rate only counts people actively looking for work. If discouraged workers stop searching, headline unemployment can understate labour-market pain. Falling participation combined with stagnant employment means many are leaving the labour market entirely — which is worse than a transient unemployment uptick.
What to monitor now: changes in the participation rate, the employment-to-population ratio, and demographic breakdowns of participation (e.g., prime-age participation) reveal whether workers are being detached from the labour market or simply delayed in re-entry. (Source: Statistics Canada)
Who is being hit hardest — inequality in the shock

Youth (15–24 / returning students): summer 2025 saw large declines in student and youth employment. Youth are often first to be laid off and last to be rehired; early-career scarring reduces lifetime earnings and career progression opportunities.
Part-time & low-wage workers: these roles absorb a lot of entry-level and flexible demand (retail, hospitality, student jobs). Part-time losses reduce the pipeline of experience that feeds full-time career paths.
Regional & non-urban workers: areas with concentrated exposure to manufacturing, construction or single-industry employers have fewer alternative openings — local unemployment can persist longer without regional hiring initiatives.
Other vulnerable groups: workers with fewer formal credentials, limited digital skills, or constrained mobility (care responsibilities, housing costs) face bigger barriers to switching into the growing AI-adjacent roles.
Why the distribution matters for policy (practical implications)
Short-term income support isn’t enough if long-term unemployment and detachment rise — we need active labour market policies that shorten unemployment duration.
Targeted reskilling & rapid apprenticeships must prioritize groups who lost entry-level roles (youth, part-time workers) — not just well-credentialed tech hires. Micro-credentials that stack into recognized credentials help bridge the gap quickly.
Regional strategies (local hiring targets, public-works pipelines, retrofit/green construction incentives) reduce geographic persistence of joblessness.
Social supports that enable mobility and participation — childcare, transportation subsidies, short relocation supports — make retraining and new jobs accessible to those with constraints.
Employer incentives (wage subsidies, subsidized apprenticeships, conditional automation grants that require a retraining fund) can shift firm choices from automation-only to human-plus-AI approaches.
Scenarios & projections: do nothing vs. moderate action vs. aggressive action
Below are three realistic, evidence-informed scenarios that show how the labour market could evolve from the July–Aug 2025 shock. These are illustrative projections (not forecasts) built from the shape of the shock, sector exposures, and the literature on automation and workforce transitions (McKinsey-style risk framing; Oxford-style downside scenarios). I give plausible ranges for additional job losses or gains, typical timelines, principal mechanisms, and the policy / employer levers that change outcomes. I also list the metrics you should monitor to know which scenario is unfolding.
Scenario A — Do nothing (downside)
Summary: policymakers and employers take only routine, uncoordinated steps (some ad hoc supports; no broad retraining push or conditional hiring incentives). Firms facing cost pressure lock in automation and permanent workflow redesigns. Demand remains weak or sluggish.
Mechanics
Employers replace routine admin, clerical and some service roles with automation or SaaS instead of rehiring when demand returns.
Job vacancies fall and remain lower; hiring freezes persist in SMEs.
Youth and part-time on-ramps evaporate, increasing long-term unemployment and regional joblessness.
Plausible effect-size (illustrative range, 12–24 months):
Additional net job losses: ≈ 100k – 350k (on top of the July–Aug 106k), depending on depth of demand weakness and pace of automation adoption.
Rationale: Oxford/McKinsey-style downside scenarios cited similar-order downside exposures when automation accelerates during demand shocks; news-commentary in 2025 referenced downside ranges starting near 100k in negative scenarios.
Timing: losses concentrated in the next 3–12 months; slow recovery thereafter.
Confidence: medium-low (highly sensitive to macro demand).
Primary sectors affected: routine professional services, administrative support, parts of transportation/logistics, construction if housing remains weak, retail & food services.
Policy & business outcome: higher long-term unemployment share, increased welfare spending, stalled consumer demand, deeper regional scarring.
Trigger signals (monitor):
Vacancies remain below 2018–19 averages for 6+ months.
Share of unemployed 27+ weeks rises materially.
New job postings show an outsized shift from entry-level postings to advertised contractor/automation roles.
Scenario B — Moderate action (partial mitigation)
Summary: targeted government measures and employer programs are launched but not fully nationwide or sustained — examples: short-term wage subsidies for apprentices, micro-credential funding, and SME grants for “human+AI” pilots that include retraining budgets. The interventions reduce the pace of automation-for-cost decisions and create some hiring pathways.
Mechanics
Conditional subsidies and apprenticeship incentives encourage firms to hire displaced workers into supervised “AI-adjacent” roles (AI operator, prompt reviewer, automation tester).
Micro-credentials and stacked certificates quickly re-skill many youth and displaced part-time workers.
SME grants cover a portion of implementation cost and require a retraining contribution, reducing the incentive to replace hires entirely.
Plausible effect-size (illustrative range, 12–24 months):
Avoided additional job losses / partial recovery: avoids ~40–70% of the downside in Scenario A. That translates to net additional losses of ~30k – 120k instead of 100k–350k, or roughly 0 to −120k in net new losses beyond the Jul–Aug 106k (depending on uptake and regional reach).
Possible net job creation in some regions: modest net job gains (tens of thousands) in urban tech hubs and regions that quickly run retraining cohorts.
Timing: improvements visible in 6–18 months as micro-credential cohorts finish and apprentices are absorbed.
Confidence: medium (dependent on program design, speed of rollout, and employer uptake).
Primary sectors benefited: professional services, transport & warehousing (logistics roles converted to higher-value task oversight), construction (if targeted retrofit/green-start incentives are included).
Policy & business outcome: reduced long-term unemployment trajectory, faster re-employment of youth and part-time workers, dampened regional scarring—but risk remains where programs are thin or uptake is low.
Trigger signals (monitor):
Apprenticeship enrollment rates and micro-credential completions rise; employer postings for “entry + training” roles increase.
Vacancy-to-unemployment ratio begins to normalize as displaced workers re-enter.
Regional unemployment rates stabilize or decline in places with cohort programs.
Scenario C — Aggressive action (rapid mitigation & transformation)
Summary: coordinated national response — rapid, well-funded retraining blitz, conditional SME transition credits (grants require retraining & hiring commitments), regional tech & reskilling hubs, and a time-limited public-works / retrofit hiring push (green construction). The approach treats automation adoption as an opportunity to redeploy workers, not simply as headcount reduction.
Mechanics
Large-scale short modular credentials (8–16 weeks) with guaranteed interview pathways and paid internships/apprenticeships co-funded by employers + government.
Conditional AI/commercialization funding tied to measurable hiring or training outcomes across regions.
Regional hubs target local demand (retrofits, public infrastructure, health-tech integration) to absorb trades and mid-skill workers.
Plausible effect-size (illustrative range, 12–36 months):
Avoids nearly all downside and can produce net job growth: prevents ~70–100% of Scenario A losses and potentially creates net jobs of +50k – +250k over 12–36 months compared with a do-nothing baseline.
Rationale: aggressive, well-targeted retraining + conditional grants rapidly re-route displaced workers into new in-demand roles and stimulate demand via public works; recovery is both supply- and demand-led.
Timing: visible improvements within 3–12 months for apprentice cohorts; more durable job-creation and net gains within 12–36 months.
Confidence: medium (dependent on execution quality and continuing demand).
Primary sectors benefited: broad – construction (retrofits & green), local manufacturing tied to infrastructure, AI service economy roles (ops, QA, integration), healthcare-support roles augmented by automation.
Policy & business outcome: faster absorption of displaced workers, reduced long-term unemployment, stronger regional rebalancing, and more inclusive tech-driven growth.
Trigger signals (monitor):
Short-term program KPIs (placements per cohort, employer commitments met).
Falling share of long-term unemployed and rising employment-to-population ratios across target regions.
Increased regional hiring in retrofit/public works and AI-adjacent roles.
Cross-cutting notes on assumptions & uncertainties
Assumptions: ranges above depend on (a) the depth/duration of demand weakness, (b) pace and economics of automation adoption by SMEs, (c) speed and design quality of policy rollout, and (d) private-sector hiring willingness to train.
Uncertainties: macro shocks (global demand shifts, tariff escalation) could worsen outcomes; conversely a quick rebound in consumer demand could make even do-nothing outcomes shallower. Technology adoption speed is endogenous — policy can influence employer decisions at critical moments.
Evidence base: these scenario shapes are consistent with McKinsey-style analyses on automation risk and workforce transitions and with Oxford-style downside scenario construction that links demand shocks + automation to additional unemployment risk. Use them as planning ranges rather than precise forecasts.
Policy & program checklist (what an aggressive program should include)

Rapid micro-credential cohorts (8–16 weeks) with employer partners and guaranteed interview slots.
Conditional SME transition credits (software/hardware grant only if employer contributes X% to retraining + hires Y apprentices).
Wage-subsidy–style hiring incentives for firms taking displaced workers into AI-adjacent roles for 6–12 months.
Regional hub funding tied to local demand (retrofit, health, infrastructure).
Monitoring & transparency: public dashboard with KPIs (placements, duration, retention at 6–12 months).
The real economy: mortgages, household balance sheets, and feedback loops with jobs & housing
Short thesis: job losses don’t stay confined to payrolls — they ripple through household finances and the housing market. Fewer paycheques → weaker mortgage affordability and lower housing demand → slower construction and fewer real-estate services jobs. That two-way feedback can deepen and prolong a downturn unless policymakers and lenders act to stabilize incomes and credit flows.
How job losses translate into mortgage stress and weaker housing demand
Income shock → affordability squeeze: when workers lose jobs or hours, their ability to service mortgage payments and other debt falls immediately. Households approaching mortgage renewal are particularly vulnerable: a lost or reduced job at renewal (or a higher renewal rate) can push monthly payments beyond a household’s budget.
Mortgage-renewal & interest-rate channel: many Canadian mortgages reprice at renewal; a wave of renewals at higher effective rates combined with rising unemployment raises renewal-risk and increases short-term mortgage payment stress for a large cohort of homeowners.
Wealth effect & demand: falling home prices reduce perceived homeowner wealth, which cuts consumer spending. Price cooling and weaker sales reduce renovation demand and dampen new-home buying, weakening related jobs.
Mortgage-market resilience — but growing vulnerabilities
Resilience so far: mortgage arrears remain low by historical standards, reflecting prior mortgage prudence and conservative underwriting. However, arrears are a lagging indicator: payment stress rises only after sustained income loss or when renewals bite.
Concentration risk: the highest renewal and arrears risk is concentrated in high-cost markets and among borrowers with large outstanding debt or thin buffers (low savings, high debt-to-income). Regional job losses thus map directly into regional mortgage stress.
The feedback loop (how jobs ⇄ housing reinforce each other)
Rising unemployment → reduced household incomes → lower mortgage affordability and higher renewal risk.
Lower affordability & weaker confidence → fewer home purchases and fewer renovations → falling sales volumes and softer price expectations.
Weaker housing demand → fewer new starts and slower construction activity → fewer construction and trades jobs, and less demand for building-supply manufacturing.
Fewer local jobs & lower incomes → weaker retail and services sales → more layoffs in non-housing sectors, reinforcing the initial job losses.
Over time this loop can cause a much larger local employment shortfall than the initial shock alone.
Why this matters for policy now
Timing is critical: mortgage arrears and defaults lag job losses. Early income supports, wage-subsidy retraining, or targeted temporary relief at renewals can prevent a small job shock from becoming a mortgage-market crisis.
Target the pinch points: policies that protect renewals (temporary bridging support, targeted amortization adjustments, or accelerated retraining tied to mortgage relief) reduce both household stress and the negative demand feedback to housing and construction.
Peak Demand AI Agency POV: outsource AI operations — agencies hire the ops staff, local businesses hire the specialists, both create jobs
(SEO: outsource AI operations, AI agencies hire, Canada job growth AI, SME human+AI grants, Peak Demand automation jobs.)
Thesis (short): for most small, medium, enterprise and public organizations, the fastest and most reliable way to capture productivity from AI is to partner with a specialist agency — not to try to build an internal AI team. Agencies absorb the operational complexity, hire the new ops roles themselves, and free client budgets to hire the specialists that actually deliver value to customers (med-spa technicians, HVAC field techs, nurses, plumbers, etc.).

The core idea — agencies hire the ops roles; clients hire the specialists
Agencies become the employers of AI ops work. Scaling automation creates continual operational work — monitoring models, reviewing outputs, triaging exceptions, tuning prompts, and maintaining integrations. Those roles (AI operator, prompt reviewer, automation ops, QA) are primarily staffed inside agencies that run AI across many clients.
Clients redeploy budget into specialist hires. Because agencies take on operating and governance costs, client firms — from a single-location shop to a provincial health authority — can reallocate the savings toward customer-facing hires and capacity (e.g., extra technicians, clinicians, field crews). The net effect is two-sided hiring: agencies hire ops talent; clients hire revenue-driving specialists.
Why agencies, not in-house teams, are usually the right move
Implementation & ops are a full-time job. Successful AI deployments need continuous attention: governance, monitoring, prompt tuning, data hygiene, safety checks and incident handling. That requires sustained devotion and repeatable processes many non-tech organizations can’t staff or keep up with.

Agencies have repeatable playbooks and scale. Specialist vendors pool experience across industries, amortize tooling and governance costs, and staff dedicated ops teams — lowering risk, cost and time-to-value for clients.
Internal teams face a steep knowledge gap. Hiring and retaining full-time internal AI specialists is costly and risky for organizations without deep engineering and data capabilities. For most non-tech firms, the expertise and cultural investment required make in-house builds fragile and slow.
What this looks like in practice (how Peak Demand operates)

Audit & build: we identify repetitive, high-value workflows to automate (scheduling, intake, quoting, basic triage). Peak Demand builds and operates the automation under a service agreement.
Agency ops hiring: Peak Demand staffs the ops roles needed to run and maintain those automations — the people who monitor outputs, flag exceptions, and improve flows over time. These are agency hires, not client hires.

Client specialist hires: clients use the resulting efficiency and freed budget to add revenue-generating specialists (e.g., med-spa technicians, HVAC field techs, nurses, plumbers). Clients get more frontline capacity without needing to run AI ops themselves.
Measurement: we track placements and outcomes — hires created at client firms, new agency ops hires, productivity gains and retention — to prove the model.
Why this model is better for non-AI organizations
Faster to live value: agencies shorten the runway — clients see efficiency and capacity gains sooner.
Lower risk: agencies bring hardened processes for privacy, compliance, and human-in-the-loop safety.
Clear job creation: automation does not eliminate local ladders if implemented via an agency model — it reallocates spend toward specialists while creating stable ops jobs at the agency level.

Sustainable career paths: agencies create repeatable roles and promotion ladders for ops staff (junior operator → senior ops → automation manager), making these bona fide local careers rather than temporary contractor gigs.
Policy & procurement design to favor job-positive outsourcing
To ensure public and private tech spending leads to job growth, procurement and grants should require vendors to:
Include a quantified hiring outcome (agency ops hires created and client specialist hirings funded by savings).
Publish KPIs up front (trainees or hires per $1M, placement/retention at 6 months).
Prefer vendors that demonstrate capacity to run accredited retraining cohorts or to hire ops staff directly.
These rules steer funding to agencies that both implement safely and expand local employment.
KPIs to demonstrate impact
Number of agency ops hires created per program.
Number of client specialist hires funded by efficiency gains.
Client productivity measures (e.g., missed calls down, billable hours up).
Retention rates for agency ops hires and for client specialists at 6 months.
Cost per successful placement (program budget ÷ retained client hires + agency ops hires).
Methodology & limitations (short, transparent)
How we built this piece (data sources & selection rules)
Headline employment counts: monthly Labour Force Survey (LFS) releases from Statistics Canada (July & August 2025) were used for the core job-loss numbers and industry breakdowns.
Timely synthesis & context: major press coverage and market reporting (e.g., Reuters and leading national outlets) were used to summarize and interpret the August release and contemporaneous market commentary.
International comparisons: national labour series from the U.S. Bureau of Labor Statistics (BLS) and official Chinese urban-survey unemployment (NBS / public reporting) were used for cross-country context.
Housing & construction risk: public sector housing outlooks and industry scenario work (CMHC, industry analysts and trade commentary such as Altus / CBRE / PwC summaries) informed the housing-linked employment exposures and tail-risk framing.
Automation & adoption evidence: industry surveys and analyst reports (major consulting firms and SMB surveys) were used to assess AI adoption trends, task exposure and likely sectoral impacts (e.g., McKinsey-style automation risk framing, SMB adoption surveys).
Institutional & academic context: peer-reviewed findings and global reports (OECD, McKinsey, WEF) were used for scenario logic and workforce-transition literature.
Selection rules & practical choices
Use official statistics (StatCan, BLS, NBS) as primary load-bearing inputs for headline counts and unemployment rates.
Use major press & market reporting to capture timely interpretations, market reactions and reported analyst scenarios for August 2025.
Use consulting / academic studies to inform scenario framing and automation-risk mechanics (technical exposure → economic adoption → labour outcomes).
Distinguish measured facts (LFS monthly changes, unemployment rates, housing starts) from scenario estimates or survey results (industry downside ranges, SMB adoption rates).
Key limitations & interpretation guidance
LFS monthly volatility & revisions: the Labour Force Survey is a sample survey; month-to-month estimates have sampling variability and standard errors. Single-month swings can be noisy. Two large consecutive negative months materially reduce the chance this is pure sampling noise, but StatCan routinely revises and updates series — treat very short-run comparisons with caution. Figures reported here are rounded for public consumption.
Cross-country comparability: unemployment rates are not fully comparable across countries because of differing survey methods (labour-force definition, coverage, urban vs national samples) and timing. Use cross-country rates for broad directional context only.
Payroll vs survey differences: administrative payroll measures (where available) and job posting/vacancy series can show different short-run dynamics than LFS. When precise payroll confirmation is needed, consult payroll series or administrative employer data in addition to LFS.
Scenario & modelling uncertainty: estimates of “jobs at risk” (housing downside ranges, automation downside scenarios) are scenario exercises, not realized counts. They illustrate potential exposures under downside assumptions and should not be read as definitive forecasts.
Survey & self-report bias: SMB adoption surveys and consulting estimates capture intentions and self-reported adoption; they can over- or under-state actual, sustained operational adoption. Use observed implementation outcomes (placements, payroll hires, productivity measures) to validate survey claims.
Aggregation masks distributional effects: national aggregates can hide sharp regional, sectoral, and demographic differences. Provincial LFS tables, industry series, and targeted cohorts (youth, part-time) were consulted to reveal distributional patterns, but local validation is advised for regional policy design.
Peak Demand anecdote: agency case vignettes and operational claims are internally observed outcomes used to illustrate the model — they are anecdotal and illustrative, not a substitute for broad statistical evidence. Wherever possible, such examples should be accompanied by measurable KPIs (placements, retention, productivity gains).
What we did to mitigate errors
Cross-checked headline job figures against contemporary press summaries and industry comment to ensure the two-month sum and percent calculations match public reporting.
Highlighted where numbers are measured (LFS counts) and where they are survey-based or scenario-based (SMB surveys, consulting downside ranges).
Kept arithmetic transparent (showed the employed population used to compute percent lost) and rounded numbers for public clarity.
Data items & metrics referenced (for replication)
Monthly employment change (LFS) — July & August 2025.
Unemployment rate (headline) — August 2025.
Industry employment change tables (LFS industry breakdowns).
Youth / student employment & part-time vs full-time splits.
Housing starts, permits and sales indices; mortgage renewal exposure and arrears indicators.
Vacancy series and job-posting intensity (where available).
Selected survey measures of AI adoption & consulting scenario ranges.
How to strengthen this analysis (what to fetch next)
Add payroll (employer) data or administrative hiring records where available to corroborate LFS moves.
Obtain provincial/municipal administrative data for local labour markets and mortgage renewal exposure.
Collect employer-level placement data from pilot programs (placements, wages, retention) to validate the agency-led hiring model at scale.
Monitor revisions and follow-up LFS releases (quarterly & monthly) to detect persistence vs. transitory movement.
Bottom line: the article uses official monthly labour data and reputable industry and consulting sources for context and scenarios. The LFS-based headline numbers are authoritative for public discussion, but short-run volatility, survey limitations, cross-country comparability, and scenario uncertainty mean readers and policymakers should treat scenario ranges and survey signals as directional input for policy design — and rely on program KPIs and administrative records to judge success of interventions.
Closing: blunt truth and hopeful call to action

The choice is stark: do nothing and risk turning a short-term jobs wobble into long-term structural damage — hollowed-out entry ladders, entrenched regional unemployment, and fewer pathways into stable careers — or act fast to convert automation into opportunity through skills, entrepreneurship and targeted public–private pilots. Canada has the research, the capital and the entrepreneurial energy to make this a renewal moment, but only if we pair tech investment with conditional hiring and retraining rules that protect ladders into work. Peak Demand’s view is simple: automation should expand capacity and create specialists, not erase on-ramps. If we design grants, procurement and SME programs around that principle we can blunt the downside and accelerate broadly shared growth.

Sources
Primary Canadian labour-market data (used for headline job loss counts, industry & demographic splits, unemployment rate and LFS methodology)
Statistics Canada — The Daily: Labour Force Survey, July 2025 — used for the July ≈ −40,800 jobs figure; student/unemployment details (reference week July 13–19) and industry / youth breakdowns.
https://www150.statcan.gc.ca/n1/daily-quotidien/250808/dq250808a-eng.htm
Statistics Canada — Release schedule / LFS calendar & timing — used to explain timing, reference weeks and when monthly LFS releases occur (lockup/embargo notes).
https://www150.statcan.gc.ca/n1/dai-quo/cal2-eng.htm
Statistics Canada — Labour Force Survey (LFS) program page / methodology — used for methodology notes, sample size, and the LFS revision/volatility pointer.
https://www23.statcan.gc.ca/imdb/p2SV.pl?Function=getSurvey&Id=1574606
Statistics Canada — Paper: The 2025 Revisions of the Labour Force Survey (LFS) — used to flag the Jan 2025 rebasing/revisions and to explain why LFS series can be revised.
https://www150.statcan.gc.ca/n1/pub/71f0031x/71f0031x2025001-eng.htm
Statistics Canada — Job vacancies, payroll & JVWS releases (Q1/Q2 2025) — used to document the decline in job vacancies (near-pre-pandemic levels / lowest in ~8 years commentary).
https://www150.statcan.gc.ca/n1/daily-quotidien/250617/dq250617a-eng.htm
(also: https://www150.statcan.gc.ca/n1/daily-quotidien/250828/dq250828b-eng.htm for payroll/vacancies context)
Contemporaneous reporting (used to corroborate and report the August 2025 numbers, market reaction and public narrative)
Reuters — Canada sheds 65,500 jobs in August 2025 (coverage synthesizing StatCan Aug LFS and market reaction) — used as the August headline job-loss reporting and for two-month total framing.
https://www.reuters.com/world/americas/view-canadas-economy-sheds-65500-jobs-august-2025-09-05/
Global News — Job vacancies fell to near 8-year low — used to illustrate falling vacancies and hiring freezes reported in media analysis.
https://globalnews.ca/news/11313465/canadian-job-vacancies-may-2025/
Reuters — Canada home prices poll / housing market slowdown (June–2025 poll) — used in the housing section to demonstrate market cooling and expert expectations for price declines.
https://www.reuters.com/world/americas/canada-home-prices-decline-2-trade-war-hits-homebuyer-confidence-2025-06-26/
The Wall Street Journal / broader U.S. press coverage — used for context on U.S. labour trends and cross-border comparisons (see BLS for primary numbers). Example article summarizing August U.S. trends.
https://www.wsj.com/economy/jobs/jobs-report-august-2025-unemployment-economy-0901d8a7
Official U.S. & international labour comparisons
U.S. Bureau of Labor Statistics (BLS) — Employment Situation (monthly releases; August 2025 release page & tables) — used for the U.S. unemployment comparison (~4.2–4.3% August 2025) and supporting tables on long-term unemployed and participation. (primary source for U.S. numbers)
https://www.bls.gov/news.release/empsit.nr0.htm
https://www.bls.gov/news.release/empsit.toc.htm
National Bureau of Statistics (NBS) / official Chinese reporting (Xinhua/Gov.cn/China Daily reporting of NBS figures) — China surveyed urban unemployment ~5.0–5.2% (H1/July 2025) — used for the China comparison and methodological caveats about cross-country comparability. Examples: Xinhua / gov.cn reporting of NBS numbers.
https://english.www.gov.cn/archive/statistics/202507/15/content_WS6875f1cfc6d0868f4e8f42be.html
(see also Trading Economics or China Daily for accessible reported series)
Trading Economics — China unemployment series (convenient chart/series) — used for quick charting and cross-year comparison in visuals.
https://tradingeconomics.com/china/unemployment-rate
Housing / construction risk & real-estate industry analyses (used to show direct and channelled job risk from housing slowdown)
Canada Mortgage and Housing Corporation (CMHC) — Market outlook / housing market reports 2024–2025 — used to document the housing slowdown, starts and outlook that feed construction jobs risk and mortgage stress analysis.
https://www.cmhc-schl.gc.ca/professionals/housing-markets-data-and-research/market-reports/housing-market/housing-market-outlook
Altus Group — Analysis quoted widely: job-risk estimates (105k–170k jobs at risk; GTA jobs at risk) — used to frame scenario / tail-risk for housing-related construction job losses (clarify: scenario modelling, not realized numbers). Example Altus insight and the Canadian Real Estate Magazine summary quoting Altus.
https://www.altusgroup.com/insights/weak-toronto-new-home-sales-threaten-construction-jobs-in-the-years-ahead/
https://www.canadianrealestatemagazine.ca/news/housing-downturn-construction-job-loss-canada/
CBRE Canada — Canada Real Estate Market Outlook 2025 — used for broader real-estate sector context and regional notes (Toronto/Vancouver/suburban corridors).
https://www.cbre.ca/insights/books/canada-real-estate-market-outlook-2025
https://www.cbre.ca/-/media/project/cbre/dotcom/americas/canada-emerald/insights/canada-market-outlook/2025-Canada-Real-Estate-Market-Outlook.pdf
PwC / ULI — Emerging Trends in Real Estate 2025 (Canada) — used to support the sectoral / council viewpoints on construction, data centers, and market segmentation.
https://www.pwc.com/ca/en/industries/real-estate/emerging-trends-in-real-estate.html
AI adoption, automation & implementation evidence (used to assess how much AI/automation is a factor, and which tasks are automatable)
Microsoft (News / Canada announcement) — Microsoft SMB report (Canada, 2025) — 71% SMBs actively using AI — used to show widespread SMB AI usage (supports Peak Demand POV that SMBs are adopting automation).
https://news.microsoft.com/source/canada/2025/06/25/majority-of-canadian-small-and-medium-sized-businesses-embrace-ai-with-71-actively-using-tools-to-drive-efficiency-and-growth/
McKinsey Global Institute — 'Jobs Lost, Jobs Gained' and other automation research — used to show task-level automability and longer-term structural displacement risks in scenarios & projections. (MGI analyses on automation exposure & scenarios)
https://www.mckinsey.com/~/media/McKinsey/Industries/Public%20and%20Social%20Sector/Our%20Insights/What%20the%20future%20of%20work%20will%20mean%20for%20jobs%20skills%20and%20wages/MGI-Jobs-Lost-Jobs-Gained-Executive-summary-December-6-2017.pdf
BCG / BCG Henderson Institute — AI adoption surveys & evidence on scaling value (Where's the value in AI? Oct 2024/2025) — used to illustrate adoption challenges and the value/capability gap.
https://www.bcg.com/press/24october2024-ai-adoption-in-2024-74-of-companies-struggle-to-achieve-and-scale-value
Deloitte — State of Generative AI in the Enterprise / Deloitte AI Institute reports — used for adoption patterns, organizational obstacles, and evidence that external partners often lift success rates.
https://www.deloitte.com/us/en/what-we-do/capabilities/applied-artificial-intelligence/content/state-of-generative-ai-in-enterprise.html
Gartner / RAND / industry commentary — project failure / abandonment rates & root causes (Gartner forecasts that a sizable share of GenAI/agentic projects will be abandoned; RAND and others document high AI-project failure) — used to motivate the recommendation to outsource to specialist agencies unless companies have deep internal capabilities. (used for the “outsourcing doubles success” thesis)
RAND report: https://www.rand.org/pubs/research_reports/RRA2680-1.html
Gartner coverage / summaries (industry media reporting on Gartner forecasts): example summaries collected in mainstream tech press.
For practical SMB evidence & implementation: industry commentary and case studies from consultancies (Deloitte / BCG / McKinsey) and trade press were used to support the argument that outsourcing to AI specialist agencies raises implementation success and speeds time-to-value.
Policy, funding & Canada’s tech investment history (used to explain why Canada has invested in AI compute & how conditioning funding could drive hiring/training)
Government of Canada — Canadian Sovereign AI Compute Strategy / AI Compute Access Fund (Budget 2024 commitment) — used to document the $2 billion (Budget 2024) compute strategy & $300M AI Compute Access Fund (context for the policy ask: tie compute funding to hiring/training outcomes).
https://www.canada.ca/en/innovation-science-economic-development/news/2024/12/canada-to-drive-billions-in-investments-to-build-domestic-ai-compute-capacity-at-home.html
https://ised-isde.canada.ca/site/ised/en/canadian-sovereign-ai-compute-strategy/ai-compute-access-fund
Government of Canada — Announcement / consultation pages and background (AI Blueprint / Budget 2024 AI investments summary) — used to show the federal commitment to AI compute, regional funding, and other AI investments cited in the policy section.
https://ised-isde.canada.ca/site/ised/en/public-consultations/consultations-artificial-intelligence-ai-compute
https://ised-isde.canada.ca/site/ised/en/public-consultations/securing-canadas-ai-advantage-foundational-blueprint
Canada — Budget 2024 coverage & analysis (various government pages & news summaries) — used to trace Canada’s recent policy trajectory and public commitments to AI. (e.g., AI Compute Challenge, regional dev funds, NRC AI Assist)
https://www.canada.ca/en/innovation-science-economic-development/news/2025/03/government-of-canada-introduces-ai-compute-access-fund-to-support-canadian-innovators.html
Historical shocks & big comparisons (used to put the July–Aug 2025 two-month loss in historical context)
Statistics Canada — Historical LFS / employment series & historical reviews (Great Recession, COVID 2020) — used to compare magnitudes (e.g., Great Recession ~400k Canadian job losses over many months; COVID 2020 March–April 2020: massive, rapid collapse). (StatCan archive & LFS historical pages)
https://www23.statcan.gc.ca/imdb/p2SV.pl?Function=getInstanceList&Id=1261739
https://www150.statcan.gc.ca/n1/pub/71f0031x/71f0031x2025001-eng.htm
U.S. Bureau of Labor Statistics (BLS) & BLS historical — U.S. April 2020 nonfarm payrolls −20.5 million — used to show scale of pandemic collapse vs. peacetime shock.
https://www.bls.gov/opub/ted/2020/payroll-employment-down-20-point-5-million-in-april-2020.htm
McKinsey & World Bank / productivity literature — longer-run comparisons of job-displacement & sector shifts — used to draw out structural patterns and prior technology shocks (to contextualize the 2-month 106k number). Example MGI / World Bank discussion of automation impacts.
https://www.mckinsey.com/~/media/McKinsey/Featured%20Insights/Employment%20and%20Growth/Globalization%20and%20modern%20work/How%20the%20future%20of%20work%20might%20evolve/what-the-future-of-work-will-mean-for-jobs-skills-and-wages-mckinsey-global-institute.pdf
https://thedocs.worldbank.org/en/doc/420881566321986726-0130022019/original/KnowledgeProdSusanLund.pdf
Media & synthesis pieces used for framing / sectoral colour
The Globe / Reuters / WSJ / Global News / Canadian Press stories on the July–Aug 2025 labour releases and housing slowdown — used to capture business-reaction quotes, labour-market spin, and narrative framing for the opener and implications. (Representative examples used in synthesis — Reuters and Global News are primary links above.)
BetaKit, Canada tech press — coverage of Canada’s AI investment & data-centre incentives (context for compute & data centre policies).
https://betakit.com/federal-government-commits-2-4-billion-to-ai-compute-startups-and-safety-through-budget-2024/
Altus/industry press — (links above) used for construction risk quotes and regional breakdowns
Methodology / limitations and why the numbers can change (used in the Methodology & limitations section)
Statistics Canada — LFS methodology pages / revisions paper / release timing (see above StatCan methodology and 2025 revisions paper). These underpin the brief methodology/limitations section: LFS monthly volatility, reference week timing, sample size, and revisions.
https://www23.statcan.gc.ca/imdb/p2SV.pl?Function=getSurvey&Id=1574606
https://www150.statcan.gc.ca/n1/pub/71f0031x/71f0031x2025001-eng.htm
BLS — technical notes on the U.S. household & payroll surveys — used to explain cross-country comparability caveats (different survey bases; household survey vs payroll).
https://www.bls.gov/bls/news-release/empsit.htm
Additional research on AI project success / outsourcing & agency evidence (used to support the “outsourcing to specialists doubles chance of success” framing and Peak Demand POV)
RAND — Root causes of AI project failure — used to explain why many projects stall and why specialist implementers help reduce failure.
https://www.rand.org/pubs/research_reports/RRA2680-1.html
Deloitte & BCG / Forrester industry surveys — evidence on outsourcing / third-party engagement improving deployment success and speed to production — used to justify recommending external AI agencies for non-tech firms (summaries & surveys). (Representative links):
Deloitte generative AI reporting: https://www.deloitte.com/us/en/insights/topics/emerging-technologies/ai-adoption-in-the-workforce.html
BCG adoption piece: https://www.bcg.com/press/24october2024-ai-adoption-in-2024-74-of-companies-struggle-to-achieve-and-scale-value
Gartner coverage summaries — project abandonment / GenAI failure rates — used to justify caution about in-house builds without deep expertise (industry summaries based on Gartner’s forecasts). (Representative media summaries collected during research.)
How these sources were used (short procedural note)
• Headline numbers & industry splits: Statistics Canada LFS July release (primary for July) and Reuters (synthesis of StatCan reporting and market reaction for August) — used to compute the two-month ≈ −106,300 jobs (sum of StatCan July −40,800 and StatCan/press-reported August ≈ −65,500).
• Unemployment & international comparisons: BLS (U.S. employment situation releases) and NBS/Xinhua/China Daily (China’s surveyed urban unemployment ~5.0–5.2% H1/July 2025) were used to compare headline unemployment rates, with caveats about survey differences cited (household vs urban surveyed series).
• Vacancies & hiring freeze evidence: Statistics Canada job-vacancy releases (Q1 2025 JVWS) and media coverage documenting “near 8-year low” were used to support the claim that vacancies are falling and hiring is slowing.
• Housing & construction risk: CMHC, Altus Group scenario modelling, CBRE/PwC market outlooks and Reuters housing polls were used to quantify the tail risk to construction jobs and the channel effects on related professional services.
• AI/automation role & implementation evidence: Microsoft SMB adoption data, McKinsey automation task analyses, Deloitte/BCG adoption surveys, Gartner/RAND findings on AI-project failure/abandonment, and industry press pieces were used to form the balanced view that AI is a material amplifier (widespread adoption) but not the only driver — and that outsourcers/AI agencies raise success rates and create operational hires.
• Policy context: Government of Canada Budget 2024 / AI Compute Strategy pages and related news releases were used to document existing federal commitments that could be conditioned to support retraining/hiring objectives.
Notes & cautions (short)
• Monthly LFS volatility & revisions: LFS monthly estimates are timely but volatile; I used StatCan’s July release (primary) and Reuters synthesis of August (StatCan reported) for the two-month total. The StatCan revisions paper and methodology pages explain why series can be revised — I flagged that in the methodology section.
• Cross-country comparability: Unemployment measures differ by country (household vs surveyed urban vs payroll counts). I used BLS and NBS official series but flagged methodological caveats in the article.
• Scenario vs. realized numbers: Industry estimates of “jobs at risk” (Altus, etc.) are scenario modelling — I used them to explain tail-risk and frame downside scenarios, and explicitly labeled them as risk/estimates, not realized losses.
Ready to turn automation into efficiency, cost savings and revenue?

Book a 30-minute discovery call with our team to get a practical pilot blueprint and a phased automation roadmap designed to maximize efficiency across your organization — we’ll assess a high-impact workflow, outline a pilot rollout, and show how those savings can be redeployed to grow your business.
What we cover on the call:
A 30-minute audit of one high-impact workflow you want to improve.
A pilot proposal with expected efficiency gains and cost-savings estimates.
An automation roadmap for scaling the solution across your organization to maximize efficiency and revenue potential.
Book a discovery call with our team to see a tailored automation roadmap and pilot plan.
Learn more about the technology we employ.
At Peak Demand AI Agency, we combine always-on support with long-term visibility. Our AI receptionists are available 24/7 to book appointments and handle customer service, so no opportunity slips through the cracks. Pair that with our turnkey SEO services and organic lead generation strategies, and you’ve got the tools to attract, engage, and convert more customers—day or night. Because real growth doesn’t come from working harder—it comes from building smarter. Try Our AI Receptionist for Service Providers. A cost effective alternative to an After Hours Answering Service.

AI Agency Digital Marketing Services
AI Guided Website Design
Our AI-driven studio builds lean, conversion-first websites—no flash, just function. We strip away the clutter and use data-backed layouts, clear CTAs, and continuous optimization to turn visitors into customers. You stay focused on growth; we make your site your top lead generator.
AI Driven SEO Services
Our AI-powered SEO services zero in on high-intent keywords and technical precision to secure top rankings, attract targeted organic traffic, and convert visitors into qualified leads—so your website works smarter, not louder.
AI Personalized Email Marketing
Our AI-driven platform crafts hyper-personalized messaging using your custom business data points and each customer’s unique journey—so every touch feels relevant, timely, and drives real engagement.
AI Automation
Our AI-driven automation suite—including intelligent voice agents—makes real-time decisions to streamline your entire workflow. Voice agents handle inbound calls, route requests, and trigger follow-up actions, while our backend automation manages task handoffs, exception escalations, and data sync. You save valuable time and boost efficiency, letting you focus on what matters most as our intelligent solutions propel your business forward.
AI Powered Chatbots
Our AI-driven chatbots are available 24/7 across every channel—website widget, SMS, email, voice agents, and social media. They instantly answer questions, capture leads, and boost customer satisfaction with seamless, efficient interactions that never sleep.
AI Powered Voice Agents & Call Centre Services
Our SOC 2-, HIPAA-, and PIPEDA-compliant AI voice agents elevate your call center operations—delivering 24/7 customer service (including after-hours) across every channel, from website widget to SMS, email, social media, and phone.
These intelligent agents can:
Handle Queries & Generate Leads: Instantly resolve questions, qualify prospects, even upsell services.
Automate Workflows: Route calls, trigger follow-up SMS or emails, and hand off complex issues to live staff.
Capture & Sync Data: Extract custom fields from conversations—patient info, service requests, consent confirmations—and funnel detailed call reports directly into your CRM.
Ensure Continuous, Secure Support: With end-to-end encryption, role-based access, and full audit logs, you maintain compliance and build trust.
Streamline operations, boost efficiency, and keep customers—and regulators—happy with focused, always-on AI voice automation.
SEO Agency Organic Lead Generation Services
AI-Driven SEO Services for Canada and U.S.
Our AI-powered SEO agency combines strategic insight with machine learning to help service-based businesses across Canada and the U.S. rank higher, get found in search and AI tools like ChatGPT, and generate organic leads at scale. Whether you're a medical clinic in Ontario or a construction firm in Texas, we tailor every SEO campaign to your location, audience, and goals.
Local SEO Services for Businesses in North America
We optimize your Google Business Profile, enhance map pack visibility, and build location-specific content that drives inbound calls, bookings, and walk-ins. Perfect for HVAC companies, dental clinics, med spas, auto repair shops, wellness centers, and multi-location brands looking to dominate their region.
Technical SEO Optimization AI-Ready Site Structure
We conduct in-depth technical audits to resolve crawl errors, broken schema, slow load speeds, and mobile UX issues. Then we optimize your architecture so your website performs better in search engines—and gets indexed and recommended by AI tools like ChatGPT and Gemini.
SEO Content Strategy & Publishing
We build conversion-first landing pages, blogs, and service content using AI-enhanced keyword research and real-time search intent. Whether you serve one city or multiple states/provinces, we write content that speaks directly to your customers and helps you rank for exactly what they’re searching for.
Competitive Analysis Intent Keyword Targeting
We uncover the high-converting keywords your competitors are ranking for (and the ones they’re missing). Then we launch SEO assets engineered to outrank them in both organic search results and AI-assisted responses.
Backlink Building Services for Canada and U.S.
Peak Demand’s backlink services strengthen your domain authority and drive organic traffic with high-quality, earned links from trusted sources. We build SEO-optimized backlink strategies tailored for Canadian and U.S. service businesses, combining local citations, industry blogs, and digital PR outreach. Our team audits, analyzes, and secures powerful backlinks that improve search rankings, support AI search visibility, and attract qualified leads—without spam or shortcuts. Perfect for businesses targeting growth in competitive markets.
SEO for RFP Visibility in North America
Want to show up when procurement teams look for vendors? We use schema markup, NAICS code targeting, and certification-rich landing pages to boost your visibility for government contracts and public RFP searches across Canada and the U.S.
AI Agency End Game Goal for Our Clients
Complete Front End Automation Solutions
Develop AI Agents that
Automate Workflows and Complete Tasks
Partner with an AI Agency in Toronto for:
Appointment Booking
Prospecting & Lead Generation
Lead Qualification
Technical Support
Customer Service
Customer Follow Up
Knowledge Bases
Human Resources
On-boarding & Training

Call our assistant Sasha and let her know what your team needs - +1 (647) 691-0082
See more agent prototypes on Peak Demand YouTube channel.
We leverage AI to power your business by:
Building powerful websites with 'intention' that convert visitors into customers.
Your website is your base camp - a critical foothold on your journey towards peak demand. We craft not just aesthetically pleasing, but high-converting websites that transform visitors into customers. From innovative design to intuitive navigation, we take care of every detail to ensure your digital platform is primed for success.
Boosting your brand's online visibility to generate high-quality leads.
In the vast digital landscape, standing out can feel like scaling Mount Everest. We're here to build a safe and reliable path for you. Leveraging a mix of SEO strategies, engaging content, and data-driven marketing, we enhance your online visibility and attract high-quality leads to your business. You can focus on your day to day, while we manage your climb to the top of search rankings.
Streamlining your digital communication with cutting-edge automation.
Effective communication is your reliable guide assisting you with client relations. We incorporate advanced technology to automate essential interactions, from follow-up emails to appointment reminders. Our comprehensive management lets you focus on providing top-tier services, knowing your communications are timely and professional.
Establishing a respected reputation within your target region and industry.
Reaching the peak of demand in your region is more than just climbing altitudes; it's about the mark you leave behind - your legacy. We aid in crafting a resilient reputation for your business, one that resonates within your service area and industry. From managing online reviews to producing impactful content, we'll ensure your flag flies high, marking your position stick as a trusted and respected leader.
Growing, manage, and cultivate your digital presence with a powerful platform.
The terrain of the digital world can be as challenging and treacherous as a rugged mountain range. We're here to guide you on your journey. By employing the right tools and strategies to manage your digital presence, we plan for your growth. Our full-service approach covers all aspects of your digital marketing. From client interactions to marketing analytics, we will navigate a clear path towards peak demand in your target market.
All-In One CRM Platform Features & AI Tools
Peak Demand gives you everything you need to power up the digital side of your business. Here's a few favourites.
Sales Funnels

Convert Website Traffic into Sales and Customers
Websites

Build Infinite Websites and Landing Pages
CRM

Store Customer Data and Build Pipelines
Email/SMS

Send Emails and Texts to Your Database
Calendars

Book Appointments on Connected Calendars
Collect Payments

Invoices, Contracts,and Online Payments are Easy
AI Automations

Build Comprehensive Workflows powered by AI
Integrations

Connect with Thousands of Apps via API
Digital Marketing CRM Platform FAQs
How much does Peak Demand's marketing platform cost, and can I cancel any time?
Peak Demand's comprehensive digital marketing platform costs $197/month for access to all features, done-for-you templates and unlimited support. Yes you can cancel any time. You can also upgrade to higher service packages for monthly services from our team.
Do I need web hosting account?
No you don’t, hosting is included.
Do I have complete ownership of any content I publish on Peak Demand?
You have 100% legal ownership of any content you create on Peak Demand or upload to the platform.
Can Peak Demand build my website for me?
Yes, our team can build your website for you. Once you are subscribed to a plan, there are additional custom services available, including website build-outs.
How many funnels, websites, courses/memberships and domains can you have?
You can have unlimited funnels, websites, courses/memberships and domains in your plan. One subscription allows you to build any number of websites.
Can I use my own domain?
Yes you can use a domain you already own. You have the ability to add unlimited domains, so you can create multiple websites. Peak Demand can also manage your domain for you as part of our custom services.
Can I deploy an AI-powered chatbot that knows specifically about my business and services?
Yes you can deploy a customer service chatbot that is powered by artificial intelligence on your website. This AI chatbot will answer prospect questions via SMS and email and can also help convert them into leads by booking them into your calendar.
How much does an AI-powered chatbot cost?
The cost of deploying a chatbot depends on the complexity and training of the AI. What do you intend the chatbot to do? How much do you want the chatbot to know? We will work with you directly to fully understand your expectations of the chatbot, and determine the best strategy for deployment and associated costs to develop.
What social media platforms does Peak Demand integrate with?
Peak Demand is integrated with Facebook, Twitter, Instagram and LinkedIn.
Can I move websites or courses from other platforms?
Any websites or courses you have built on other platforms will need to be rebuilt on Peak Demand but it’s easy to do and we will help you create a migration plan. Most of our users are fully migrated within about 2 weeks. *This will depend on how much content you have to migrate.
Can you build a membership/subscription site with Peak Demand?
You can build membership websites and sell all kinds of digital offers including courses, digital products, audios, and 1-to-1 coaching.
Can I keep my existing website and use Peak Demand for everything else?
If you are currently using WordPress, and want to take advantage of some of the tools on Peak Demand, we will support you on integrating your current website with our platform.
Are the websites and pages mobile responsive?
All pages created with Peak Demand are fully responsive and mobile-friendly. All internet traffic is over 80% mobile. Being mobile ready is a necessity for any business.
What payment gateways integrate with Peak Demand?
Stripe, PayPal, Authorize.net & NMI.
Does Peak Demand offer an analytics/stats dashboard?
Peak Demand will give you access to lots of data about your business including your emails, pages, courses and customers.
AI Call Center Solution FAQs
How do Peak Demand's AI call center solutions revolutionize customer service for businesses and government agencies?
Peak Demand's AI call center solutions deploy AI voice agents capable of autonomously managing phone interactions, facilitating scalable and efficient customer service around the clock for both business and government entities, transcending traditional service limitations.
What types of interactions are managed by Peak Demand's AI voice agents across different sectors?
Our AI voice agents are adept at handling a diverse range of inquiries and tasks, from transactional conversations and scheduling to complex problem resolution, tailored to meet the unique demands of both the private and public sectors.
How are Peak Demand's AI call center solutions customized to meet industry and governmental requirements?
We custom-develop our AI call center solutions to align with specific sector needs, equipping our AI voice agents with sector-specific protocols and terminologies to ensure they deliver pertinent and effective support for both businesses and government agencies.
Can Peak Demand's AI voice agents provide multilingual support for diverse demographic needs in business and government?
Yes, our AI voice agents are built to support multiple languages and dialects, catering to a wide demographic spectrum and ensuring effective communication in different languages, critical for both international businesses and multicultural governmental interactions.
What data security measures are in place within Peak Demand's AI call center solutions to safeguard business and government data?
Our AI call center solutions incorporate top-tier security measures by leveraging third-party security technologies from leaders like OpenAI, Google, and others. This approach ensures robust encryption and compliance with international data protection standards, securing sensitive information for both our business and government clients efficiently and reliably.
How does Peak Demand ensure ongoing support and maintenance for AI call center solutions servicing businesses and government?
Peak Demand actively ensures the uptime of our AI call center solutions through dedicated technical support and proactive maintenance. By continuously monitoring and updating our systems, we minimize any potential disruptions in service, providing reliable and effective operations for both business and government clients.
How does Peak Demand assist businesses and government agencies in measuring the effectiveness of AI call center solutions?
Peak Demand offers a specialized service where we perform a comprehensive and customized analysis of performance metrics such as engagement rates, problem resolution efficiency, and user satisfaction. This service provides detailed insights that enable leadership in business and government to make informed, data-driven decisions to enhance operational effectiveness.
How quickly can Peak Demand's AI call center solutions be deployed within our existing infrastructure?
Deployment speed is key to keeping pace with business demands. Our AI call center solutions can be integrated rapidly—typically within a few weeks—depending on the specific needs and existing infrastructure of your organization. We work closely with your IT team to ensure a seamless transition with minimal disruption.
Are there opportunities for customization or integration with other tools and platforms?
Absolutely, our AI solutions are highly customizable and designed to integrate smoothly with a variety of existing tools and platforms, including CRM systems, database management software, and other enterprise applications. This integration capability ensures that our AI voice agents can operate effectively within your operational ecosystem.
How does your AI technology adapt to changes in call volume or customer service needs?
Our AI call center solutions are built with scalability in mind. They can easily adapt to increasing call volumes or changing service requirements without the need for significant additional investments. This flexibility ensures that you can maintain high service levels during peak times or as your business and services grow in demand.
Can your AI solutions capture and utilize customer feedback to improve service?
Yes, our AI systems are designed to capture customer feedback in real-time. This input is analyzed to continually refine and improve the interactions, ensuring that the service evolves to meet user expectations and enhances customer satisfaction over time.
How does Peak Demand comply with industry-specific regulations and privacy laws?
Compliance is paramount. Our AI solutions adhere strictly to industry-specific regulations and privacy laws, ensuring that all customer data is handled securely.
What are the financial implications of adopting Peak Demand's AI call center solutions compared to hiring human agents?
Implementing our AI solutions involves an initial investment which, while significant, is often lower than the ongoing costs associated with hiring human agents. Unlike human-operated call centers, AI call center solutions do not recur expenses like salaries, benefits, and training for a large number of staff. Organizations using our AI typically experience a substantial reduction in operational costs. Moreover, the efficiency and scalability provided by AI lead to improved customer satisfaction and potential for increased revenue. Over time, the ROI from AI can significantly surpass the costs associated with maintaining a human workforce. Our team is prepared to provide a detailed cost-benefit analysis to help you understand the financial impacts and advantages of adopting our AI solutions versus hiring human agents.
Peak Demand AI Agency Automation Services & SEO
Serving businesses and government across Canada and the U.S.
Read Our Peak Demand Blog
Peak Demand CA on LinkedIn
@PeakDemandCa on X (Twitter)
@PeakDemandCanada on Facebook
@PeakDemandCanada on Instagram
@PeakDemandCanada on Youtube
Toronto AI Agency Compliance Standards
- Canadian AI agency with enterprise-grade Voice AI solutions
- Regulated sectors: Healthcare, Government, Utilities, Finance,
- SOC 2 Type II readiness, HIPAA/PHIPA/PIPEDA alignment
- BAAs & IMAs available for U.S. and Canadian custodians
- Documentation: PIA frameworks, retention policies, encryption
- Privacy-by-design workflows & access control governance
- Audit-ready architecture with change logs & SLA
AI RFP Supplier Vendor Applicable NAICS Codes for Voice AI & IVR Solutions
541511 – Custom Computer Programming Services
Relevant for building custom Voice AI agents, IVR logic, and conversational AI workflows.
541512 – Computer Systems Design Services
Applies to integration of Voice AI with CRMs, ERPs, EMRs, and enterprise software systems.
541513 – Computer Facilities Management Services
Covers managed hosting, monitoring, and uptime support for AI-powered voice platforms.
541519 – Other Computer Related Services
Used for AI deployments that include analytics, call tracking, and cloud IVR functions.
517911 – Telecommunications Resellers
Pertains to reselling dedicated AI voice lines and virtual call center infrastructure.
518210 – Data Processing, Hosting, and Related Services
Supports services involving real-time voice data handling, transcript processing, and compliance storage.
519190 – All Other Information Services
For informational voice agents such as public service lines, 311 support, and automated directories.
561422 – Telemarketing Bureaus and Other Contact Centers
Directly applicable to Voice AI agents replacing or supporting live agents in call centers.
621999 – All Other Miscellaneous Ambulatory Health Care Services
Used for healthcare-related voice agents handling patient calls, triage, and scheduling.
541611 – Administrative Management & General Management Consulting Services
Relevant for voice AI vendors supporting RFP strategy, compliance, and automation consulting.
928120 – International Affairs
Used for multilingual or cross-border Voice AI deployments in government-facing RFPs.
926150 – Regulation, Licensing, and Inspection of Miscellaneous Commercial Sectors
For municipal and regulatory agencies using AI for permit intake, inspection scheduling, and more.
813920 – Professional Organizations
Applies to voice-based services used by membership associations, unions, and regulatory bodies.
Copyright © 2025 Peak Demand - All rights reserved.
This Website is Powered By and Built On Peak Demand